Lab Write Up - Xintra - KG Distribution
Exploration of memory analysis with MemProcFS. This post dives into an interesting Xintra lab challenge, hunting for malicious processes, persistence mechanisms, data staging and more.

Firstly, if you haven’t already, please head over to Xintra and check out the educational content on offer. Its an invaluable resource for the cyber security community. Additionally check out the Xintra discord (see link on Xintra site) for assistance with the labs and general banter.
The following article is a write up of the KG Distribution lab hosted on Xintra. This lab explores memory analysis with:
- C2 Analysis & Identification
- DLL Injection Techniques
- Persistence Techniques
- Exfiltration & Staging
I’d strongly recommend first attempting this lab without following this or any walk through. This write up is for my own learning reinforcement and those who need a small helping hand.
Where possible I’ve tried not to list the actual answer more so direction on how to obtain it.
TL;DR - Write up of KG Distribution from Xintra created by @13cubed
I’ll fly through the easier questions without too much explanation and dive deeper into the harder questions.
Scenario
The scenario is covered over on Xintra’s lab page, I’d encourage checking it out over there.
The short version is HR clicked something they shouldn’t have, SOC have investigated and now we have multiple memory dumps to analyse(one server and one workstation).
Setup
We don’t have much setup to do, all we have to do is launch our VM within the Xintra environment to get the lab started. It will contain most, if not all, of the tools needed to complete the lab.
From there we just have to parse the .vmem files we are given with MemProcFS. If you need a refresher on MemProcFS usage have a look at me previous blog post.
In short, run the following command to mount the memory dump and parse.
MemProcFS Command
c:\<path to memprocfs binary)\memprocfs.vmem -device <path to vmemfile> -forensic 1 -license-accept-elastic-license-2.0 -mount <drive letter>
I’ve mounted with a drive letter so I can parse and mount two mem dumps at one. If you don’t specificity a mount point it will try to mount both at M and conflict.
Workstation Flags
Remember, at times there are multiple ways to obtain the answer to some of these questions. The below articulates the ways I found when navigating through this lab.
Intro Questions
-
What is the hostname of this device?
MemProcFS will give you a “filesystem” like structure to browse through with relevant artifacts. In order to get the hostname of the device navigate to the A:\sys\computername file (noting the mount point will change depending on what you set it to when launching MemProcFS).
-
What is the name of the domain to which this workstation is joined?
The most straightforward way I found to obtain the domain name of the workstation was through the registry. This can be found within HKLM\SYSTEM\ConmtrolSet001\Services\Tcpip\Parameters\Domain
Noting you can also pull out answers to other questions there aswell like hostname and IP address.
-
What is the username of the primary user on this device?
Under the A:\sys\users folder you will be able to find users on the system.
-
What is the IP address assigned to this device?
The IP address can be found in A:\sys\net\netstat.txt however this can be found elsewhere in the file system (registery…etc)
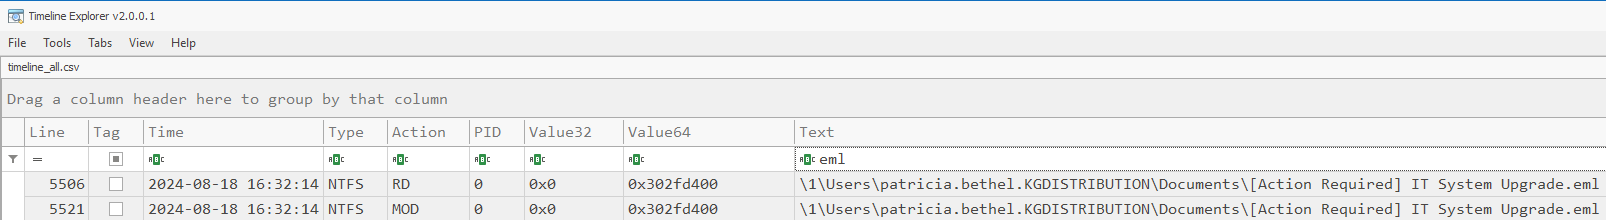
What time did the user open the malicious phishing email?
When we launched MemProcFS we specified the -forensic 1 flag which parses memory with included yara rules. In this case we have timeline and filesystem information we can use to answer this question.
Navigate to A:\forensic\timeline. There are also csv files in the csv folder.
Thinking about what we’d be looking for on disk I used the timeline_all to search for email related entries that might point to the user opening an email. In this case I used .eml as my search parameter to reveal interaction with on disk email files.
From there the first interaction with this file will get us our answer seen below.
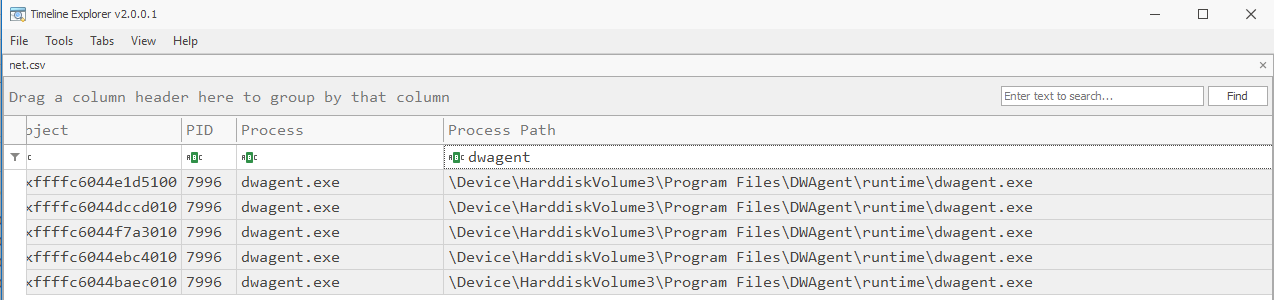
What is the name of the remote administration tool downloaded and used to gain a foothold on the system?
A few ways we can tackle this one, when thinking about remote access tools and what we’d expect makes a few things come to mind. Files on disk, processes running and remote connectivity.
An easy way to approach this one is looking for remote connectivity, note: we are assuming the remote admin tool was running at the time of memory capture.
Head on over to A:\forensic\csv\net.csv at look for anything out of place. In this case dwagent stood out to me as suspect along with a few other things which will come up in later questions.
What is the earliest execution time of the remote administration process running on the system?
Now that we have the name of the RMM tool, to get the execution time of the process we can navigate to A:\sys\proc\proc.txt to get further process information.
This will show you a hierarchical view of processes running at the time of capture. Look for dwagent and associated process create time in its respective column.

Around the time of compromise, the threat actors utilised a file transfer tool to download a malicious binary. What is the name of this tool?
The way I tackled this one was probably wasn’t the best, I looked in timeline_all for evidence of execution (prefetch) during our activity window.
Navigate to A:\forensic\csv\timeline_all.csv and look for events related prefetch indicating use of known binary names for tools that may assist with file transfer. You will quickly notice a common tool used for file transfer among other things.
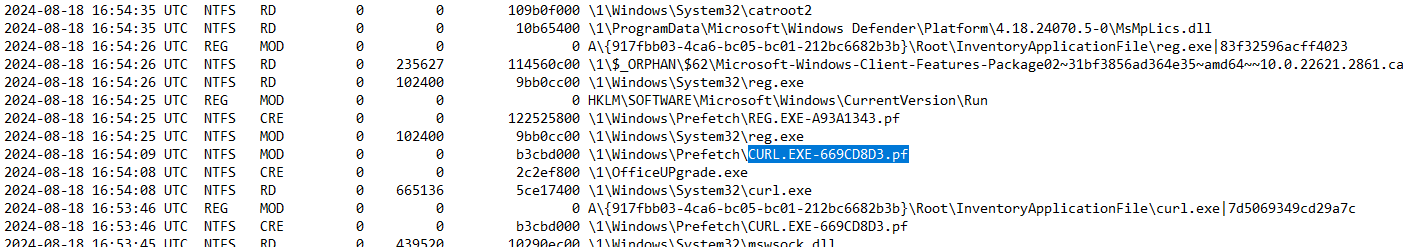
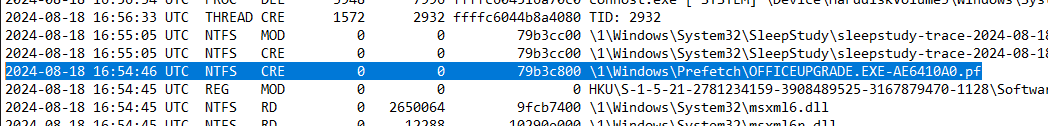
What is the name of the malicious binary that executed roughly one minute after being downloaded?
If you noticed in the previous image there was already indication of a suspect binary being brought into the environment (OfficeUPgrade.exe). We also saw this in the netstat output which immediately seemed out of place.
To further confirm our suspicions we can look at the prefetch entry for officeupgrade.exe noting its time is roughly one minuet after we saw its entries on disk and curl being run.
The malicious binary used the registry for persistence. What is the full path of the registry key used for persistence?
Based on the question we know this will be a registry event so lets navigate straight to A:\forensic\csv\timeline_registry.csv.
Thinking about persistence we know two registry autostart points that are commonly abused are Run and RunOnce. Looking at registry activity we can see indication of run keys being manipulated during our attacker window.

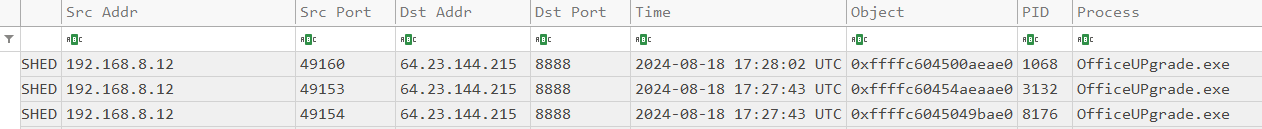
What is the attacker IP address and port to which the malicious binary connected to?
Back to netstat lets look at what our OfficeUPgrade.exe is connecting out to. This one is fairly straight forward so navigate to A:\forensic\csv\net.csv.
Look for OfficeUPgrade.exe and its associated remote IP address.
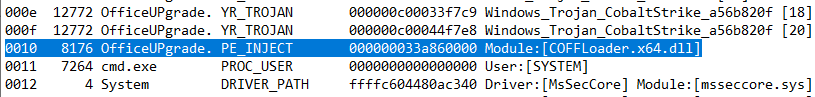
What is the name of the malicious loader DLL that’s injected inside the malicious binary?
For this question we can lean on the forensic functionality of MemProcFS. During initialisation we specificed the forensic flag and accepted a license agreement. This will run a number of yara rules across the .mem file and pull out suspicious artifacts placing them in findevil.txt.
If you are curious you can look at the yara rules in A:\forensic\yara.txt.
Navigate to A:\forensic\findevil.txt and look for PE_INJECT events related to the OfficeUPgrade.exe binary.
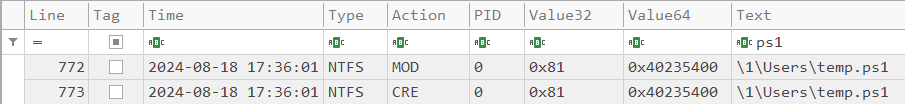
Review the NTFS artifacts for other suspicious files created around the time of compromise. Can you locate the file name of the malicious script?
Navigate to A:\forensic\csv\time_ntfs.csv and look for file creation around the time frame of our attacker activity. We are working with a windows system so we can guess that it might be a .ps1 file to speed up the process.
This leads us to a temp.ps1 script during our time window.
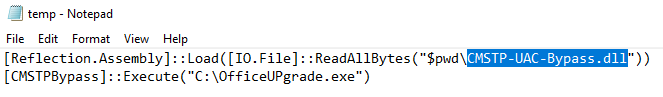
What is the name of the malicious DLL invoked by the threat actor-created script using reflective DLL injection?
For the last of the workstation questions if we navigate to A:\forensic\ntfs\1 we are able to browse the file system and pull out the script referenced in the previous question.
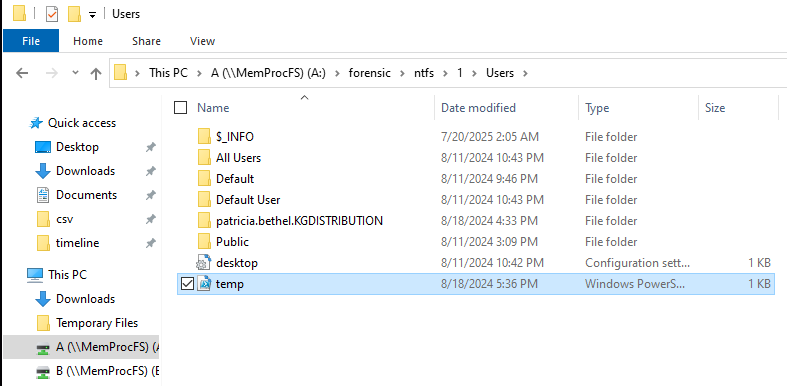
Opening the script reveals the malicious DLL invoked during reflective DLL injection.
Server Flags
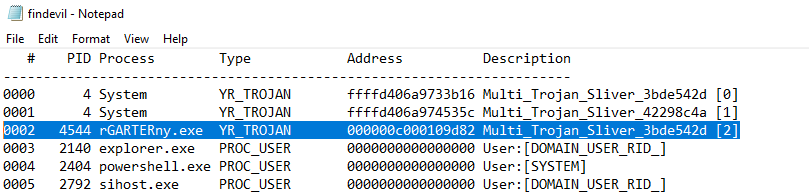
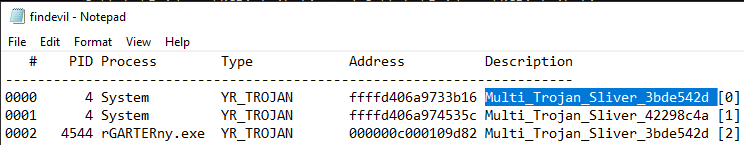
What is the PID of the malicious process?
A straight forward way to start this would be to look at B:\forensic\findevil.txt for yara rule hits. Opening this we immediately see a strange binary file with reference to sliver (a popular c2 framework).
You could also look at the process under B:\sys\proc\proc.txt.
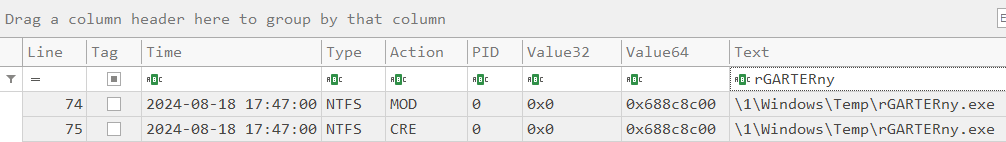
What is the full path and filename of the malicious process?
Looking at the ntfs timeline under B:\forensic\csv\time_ntfs.csv we can directly search for rGARTERny finding two entries suggesting its located under windows\temp.
What is the parent process that spawned our malicious process?
Navigating to B:\sys\proc.txt we can look at the full process tree, its just matter of looking for our malicious process and observings its PPID. Once you have a PPID you can link it back to a named process (scroll up till you find it in that proc.txt file).
You can also get the PPID from B:\4544\ppid.txt. Tie that to a process name and you’ll have the answer.
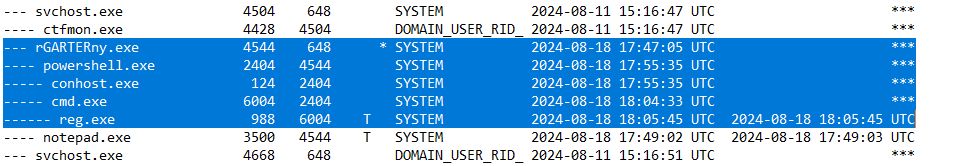
What is the name given to the persistence mechanism created to launch the malicious process?
When we think persistence mechanisms, services come to mind and knowing our PPID we know its likely a service we are chasing.
Lets have a look at our installed services located in B:\sys\services\services.txt. Opening this we can search for rGARTERny.exe as we know this is our malicious binary name.
Looking at the service name will get you the answer.

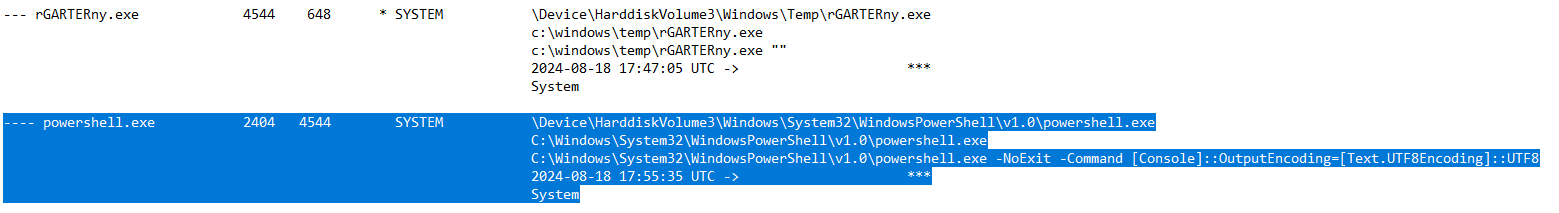
What is the command line used by the child process of our malicious binary?
Navigating to B:\sys\proc\proc-v.txt we are able to view verbose output of processes. This is a straightforward way to see path and command for processes and will assist us with answering this question.
If you remember when we observed the fill process tree, proc-v will also be presented in a similar way. If we search for rGARTERny.exe we are able to see the process and its child processes which is what we are after.
Look for powershell.exe and its command line processes used when invoked.
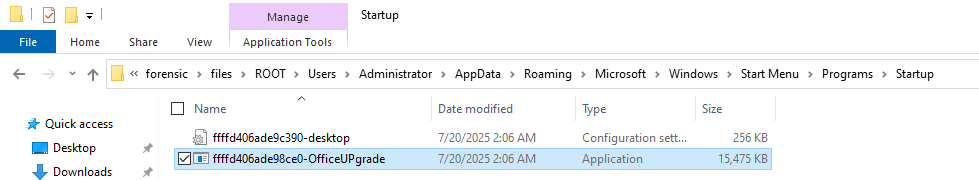
Take a look at the malicious process, can you identify a specific file path it used for persistence?
This one was a bit tricky, I ended up looking at the handles associated with the malicious process (4544). Looking at the file handles we notice the following: \HarddiskVolume3\Users\Administrator\AppData\Roaming\Microsoft\Windows\Start Menu\Programs\Startup
This is a popular user specific auto extensibility point used for persistence.
The file path identified in the question above was used for persistence for a second binary. What is the name of the binary?
Knowing the above path we can navigate directly to the path ondisk at B:\forensic\files\ROOT\Users\Administrator\AppData\Roaming\Microsoft\Windows\Start Menu\Programs\Startup
Navigating to that location will show you an additional binary used for persistence.
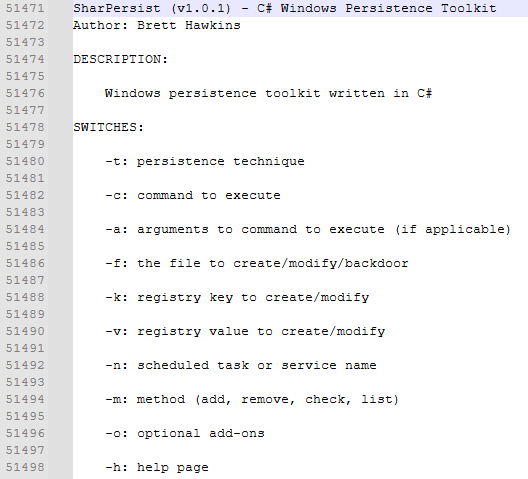
What is the name of the persistence tool that the threat actor attempted to use?
This question was the hardest question of the lab and took me a while. Admittedly I got lucky finding this answer. Within the folder for the PID of our malicious process there is a minidump file which is a dump of the processes memory associated with the process.
After searching through the minidump with a combination of strings and notepad++ I was able to find reference to SharPersist. To find this try looking for strings of specific length and plain text/words we think might appear.
What C2 framework is in use on this device?
The C2 framework was already uncovered in previous quesions. Navigate to B:\forensic\findevil\findevil.txt looking for popular C2 frameworks.
There are two additional questions I’ll leave unfinished so the whole lab isn’t completely solved for you. Think of those questions as homework if you are heavily relying on this write up for the answers.
Hoping this write up will point you in the right direction if you are stuck or you learnt something new about MemProcFS.
Good Luck!